Preload settings
Choose your channel and split settings. Only some data formats allow for multiple recording channels, so unless you need to, the channel feature can be left at 1. Split should only be used if your data varies in length or if you want to split a continuous recording wave into smaller chunks for parallel processing.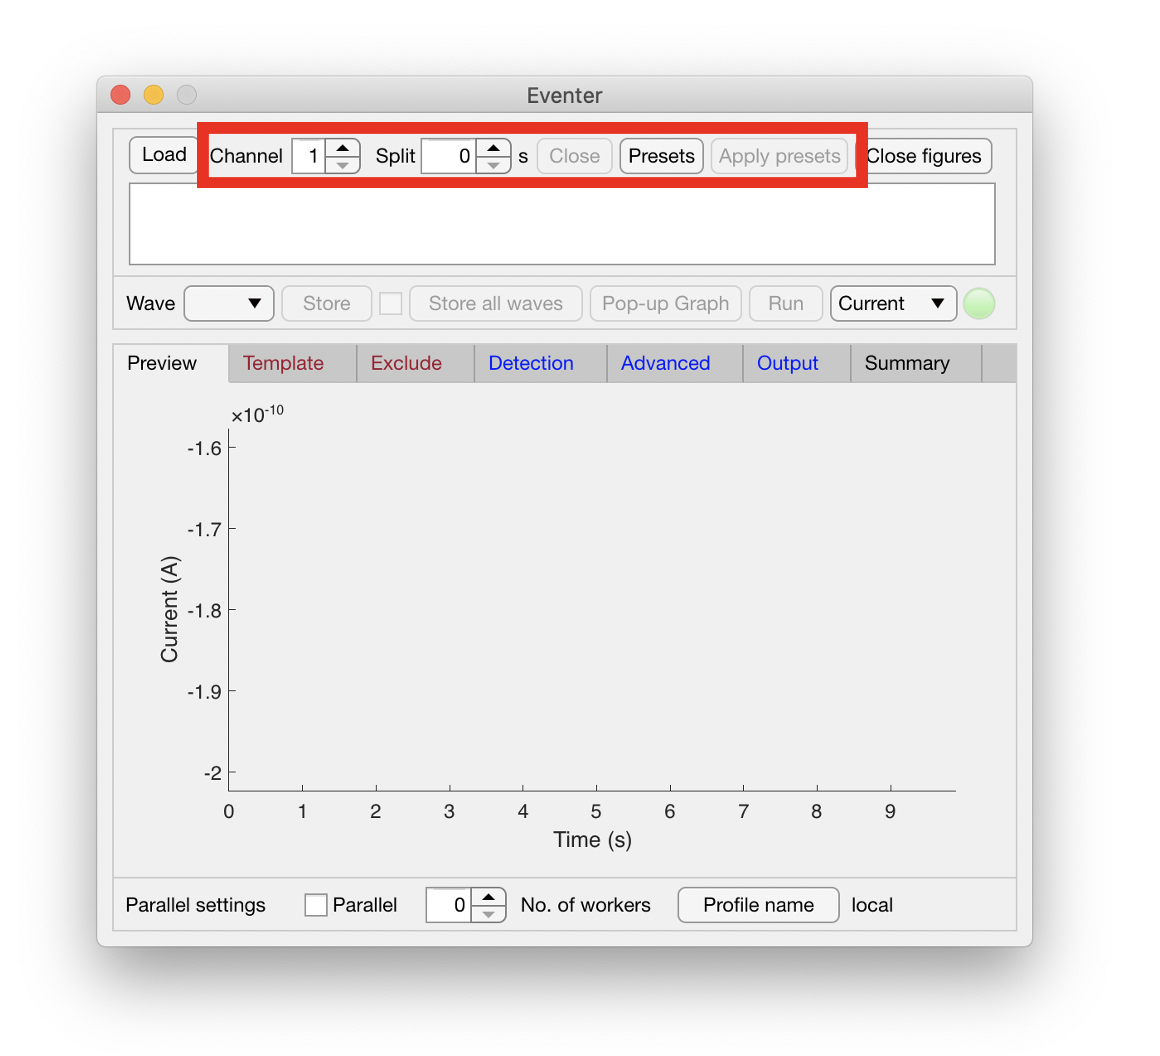
Loading your data
Choose which data you wish to analyse. Multiple data sets can be analysed at once. Eventer will merge these data sets together so ensure you are loading data that you want merged. To load multiple data sets to be merged, simply repeat the loading process shown below.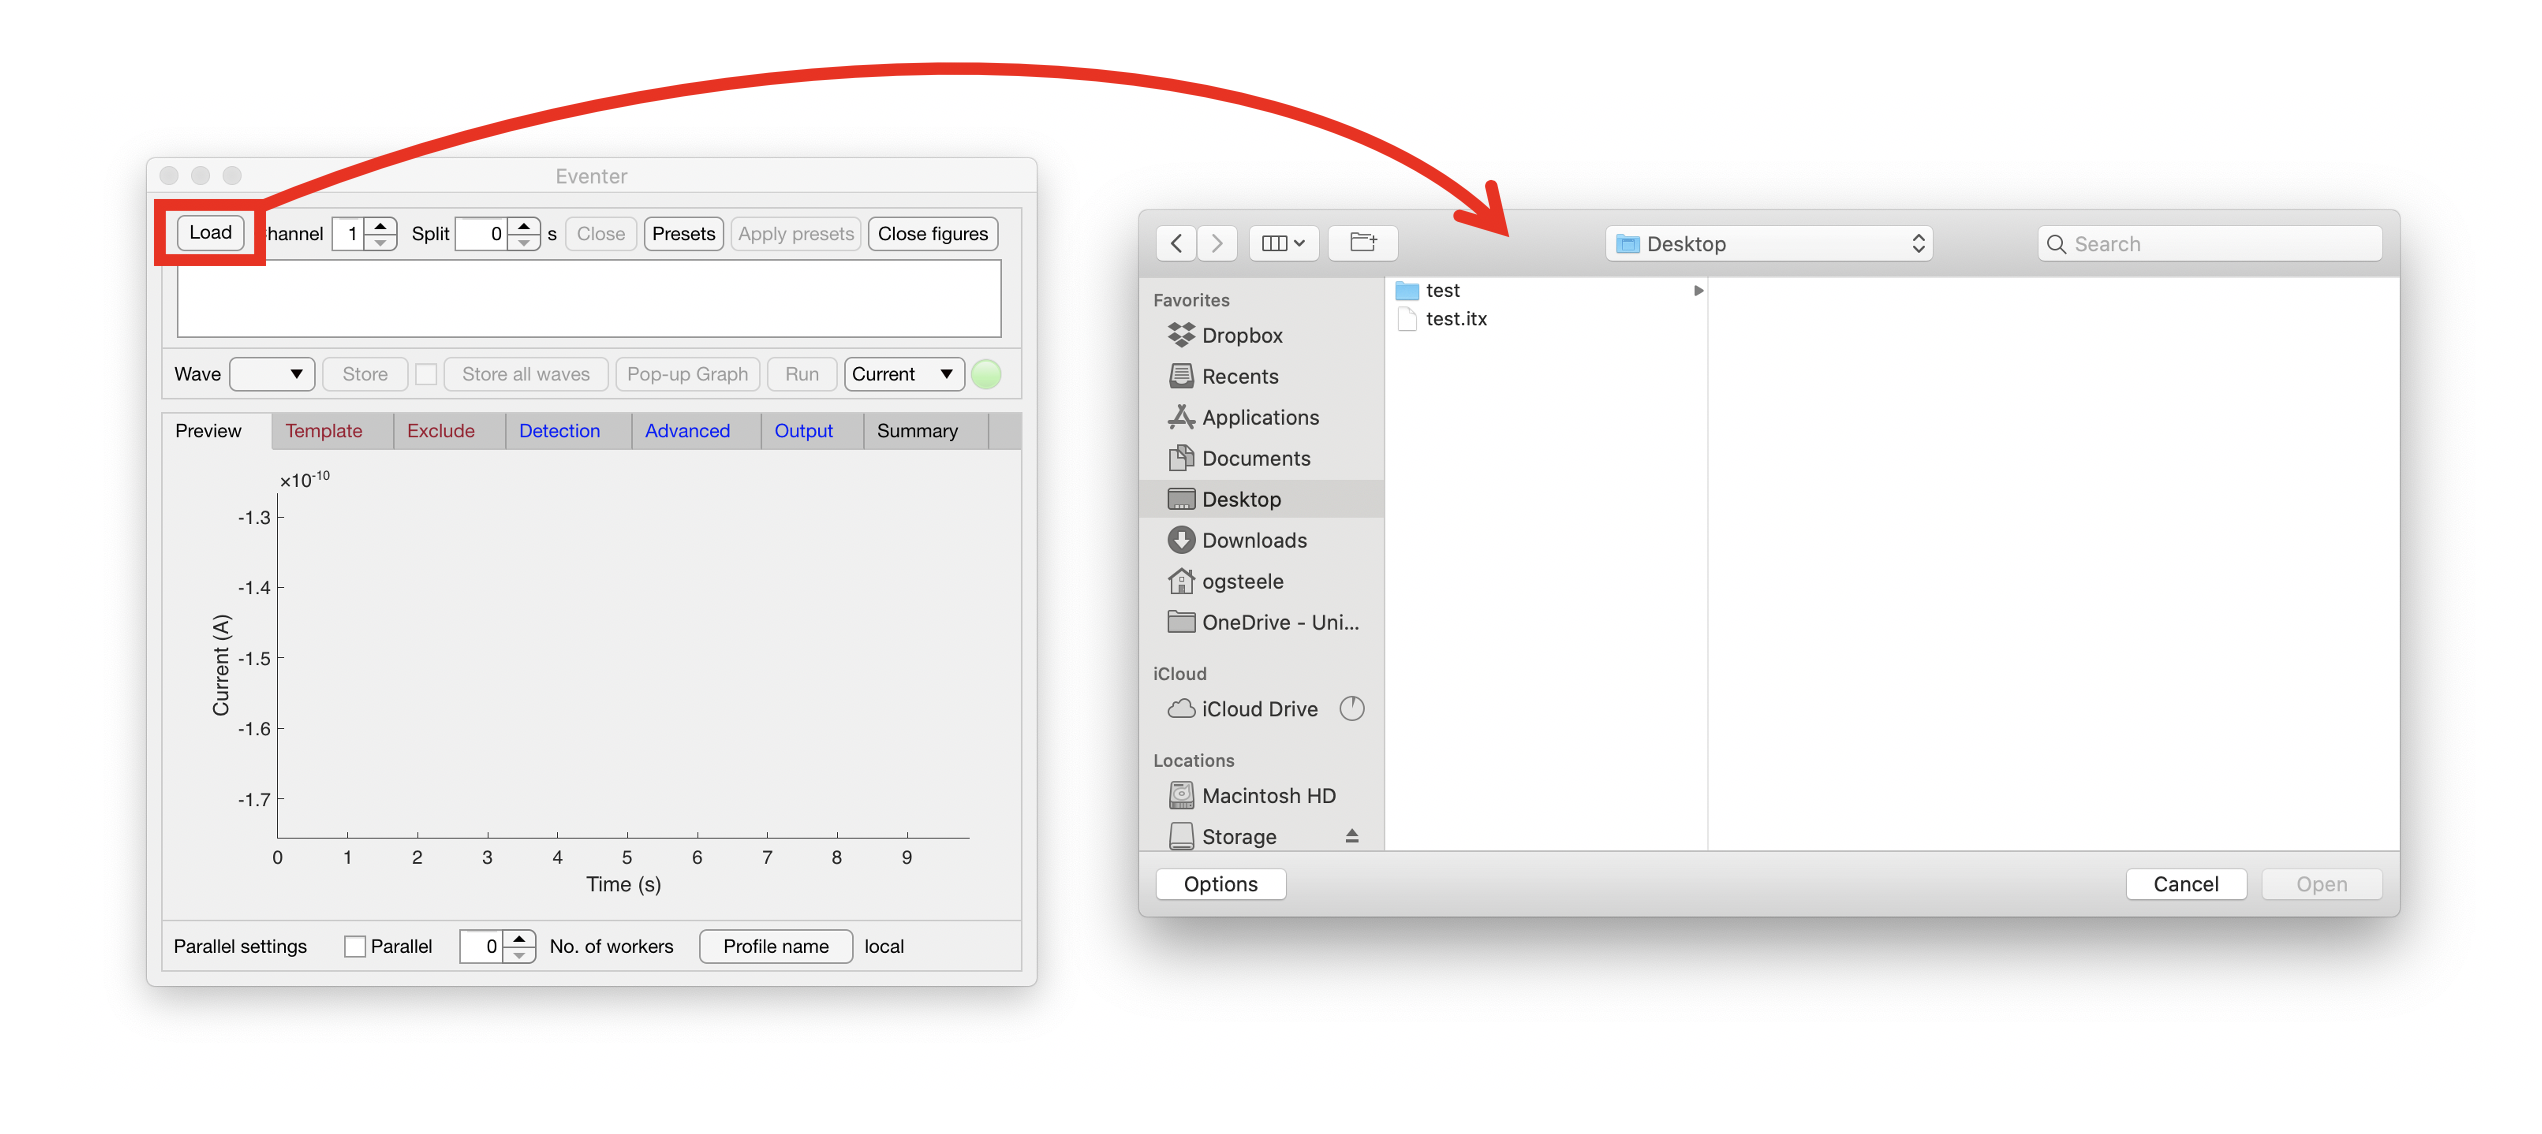
Visualising your data
Eventer includes a preview tab for immediate visualisation of your data upon loading. To inspect the data in more detail, the ‘Pop-up Graph’ should be used as shown here. This graph can then be zoomed and dragged to located individual events.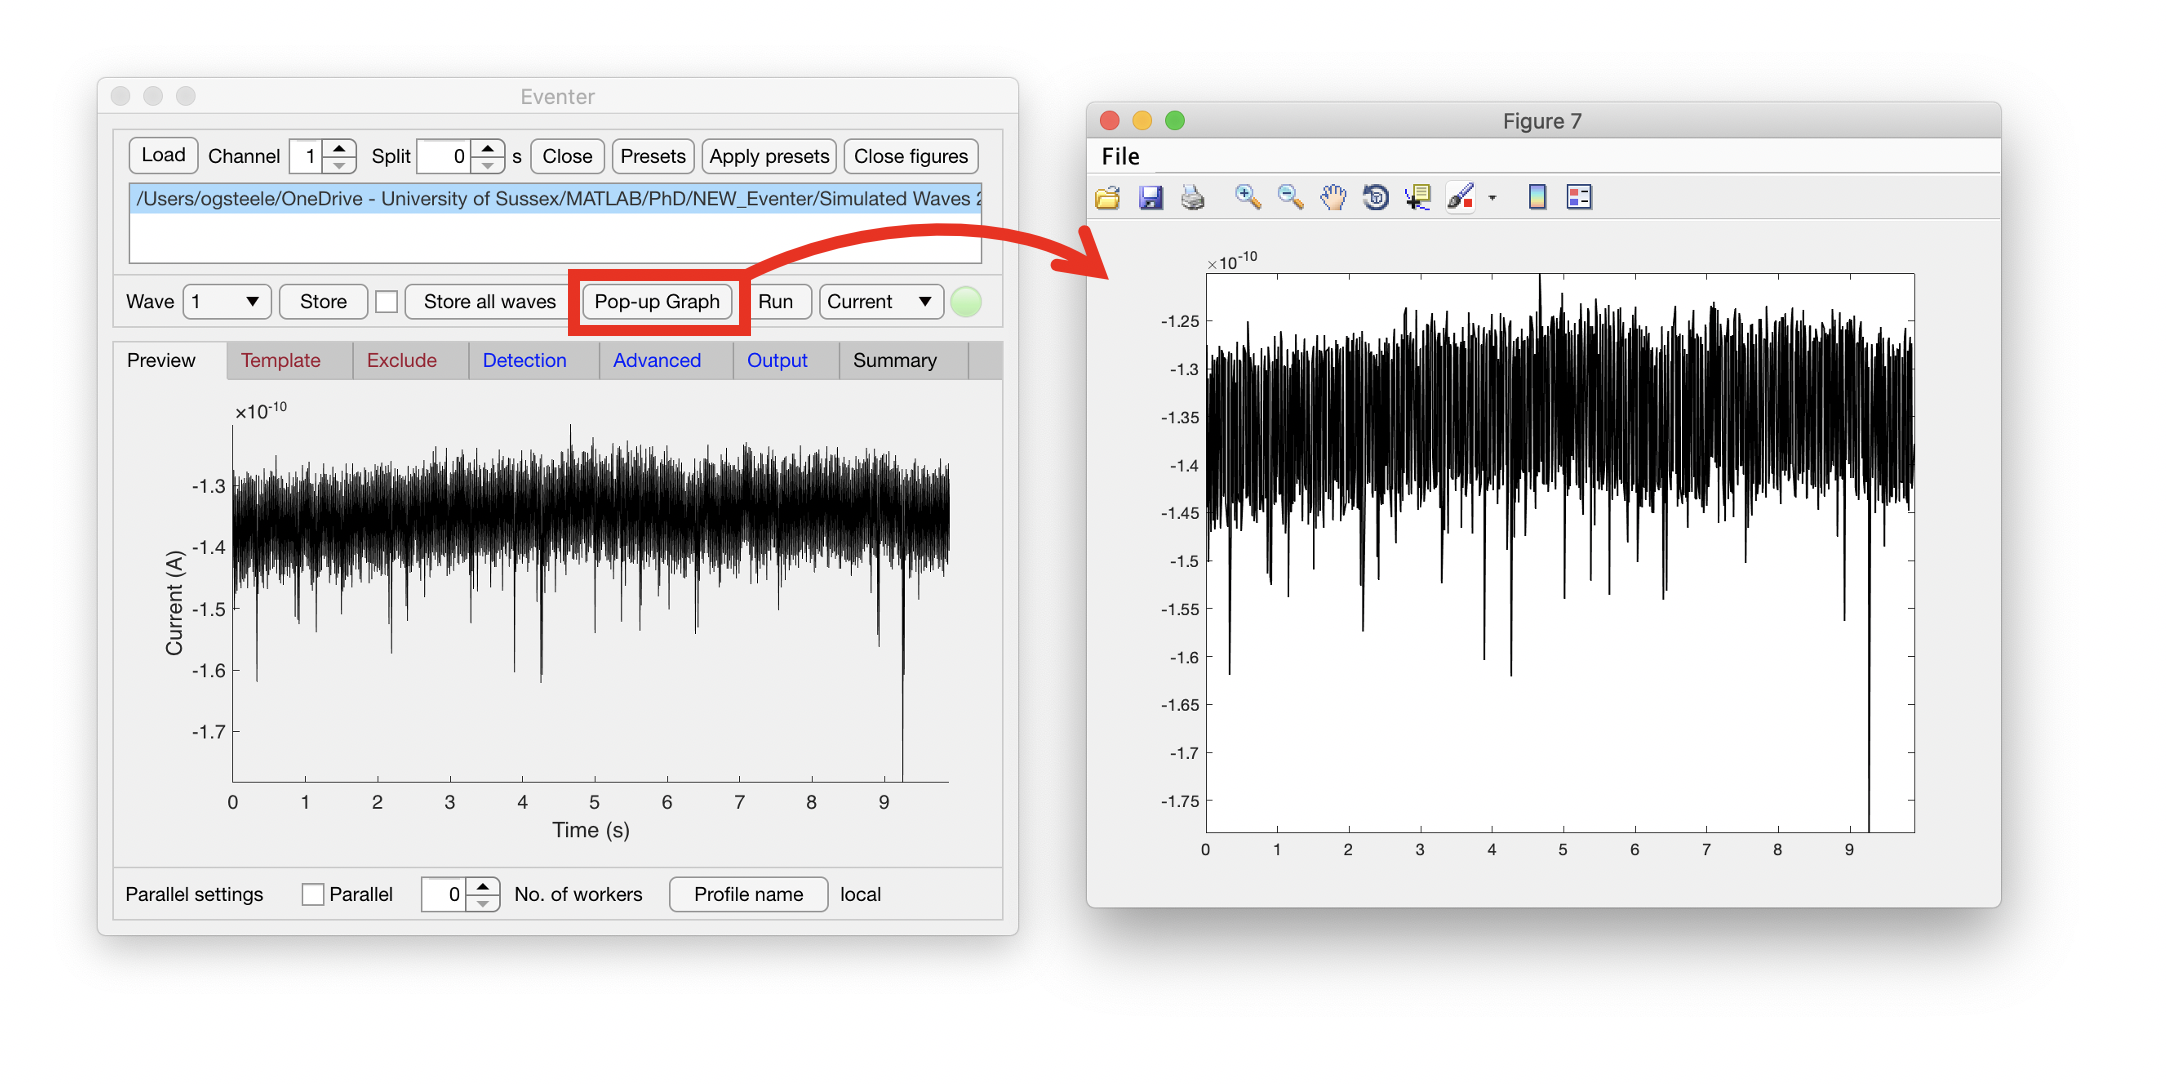
Prefiltering your data
It is possible that excess noise is still present in your data that may not have been isolated during data acquisition. To help visualise data, Eventer enables the user to pre-filter their data through high- and low-pass filter cut offs. Shown here, a 1 kHz low-pass filter is applied to the data in the detection tab.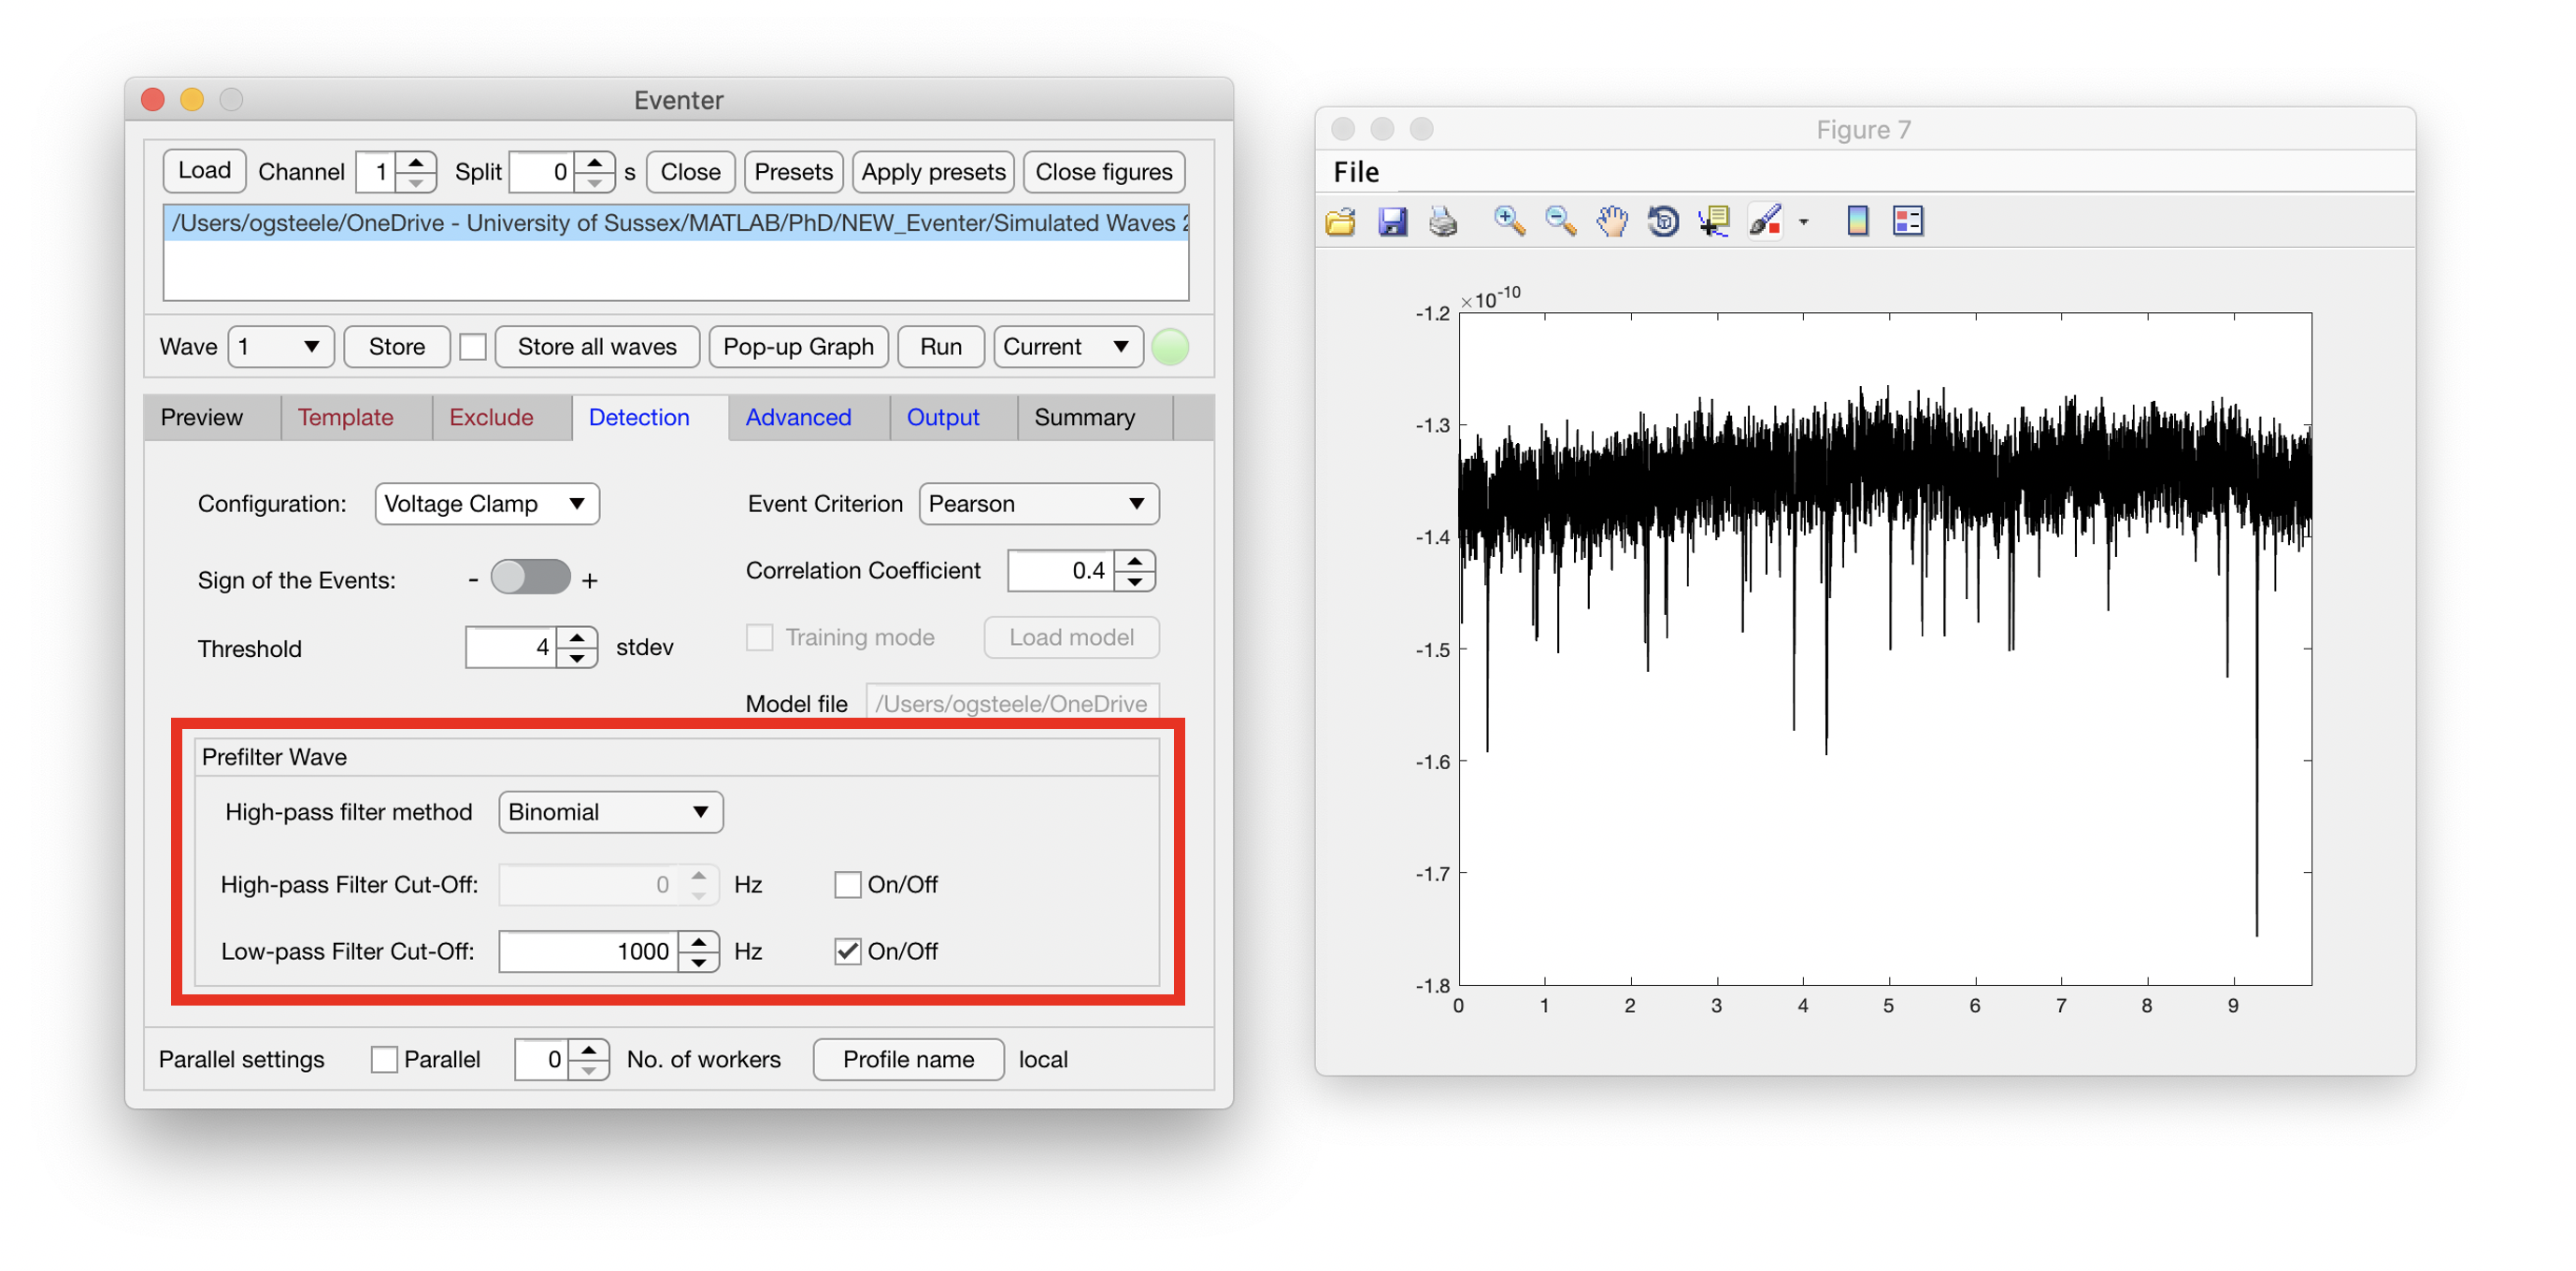
Defining your event template
In the template tab you can set a template event for the software to compare your data against. This can be set manually if the rise and decay parameters of your events are known, or can be done through opening the ‘Pop-up Graph’ as mentioned before and selecting the button highlighted here. This will allow the user to select two points; one before and one after the event of interest. The time constants will then be in the boxes below the highlighted button and should then be copied into boxes above before selecting the button ‘Apply to all waves’. It is worth locating an event in the ‘Pop-up Graph’ before defining the time constants and that the sign of your events is correctly stated in the detection panel.
Once happy with your settings you may want to save these as ‘Presets’ to enable quicker analysis in the future. These can be loaded in the very first step “Preload Settings” and we’ve provided a couple of examples for you
here.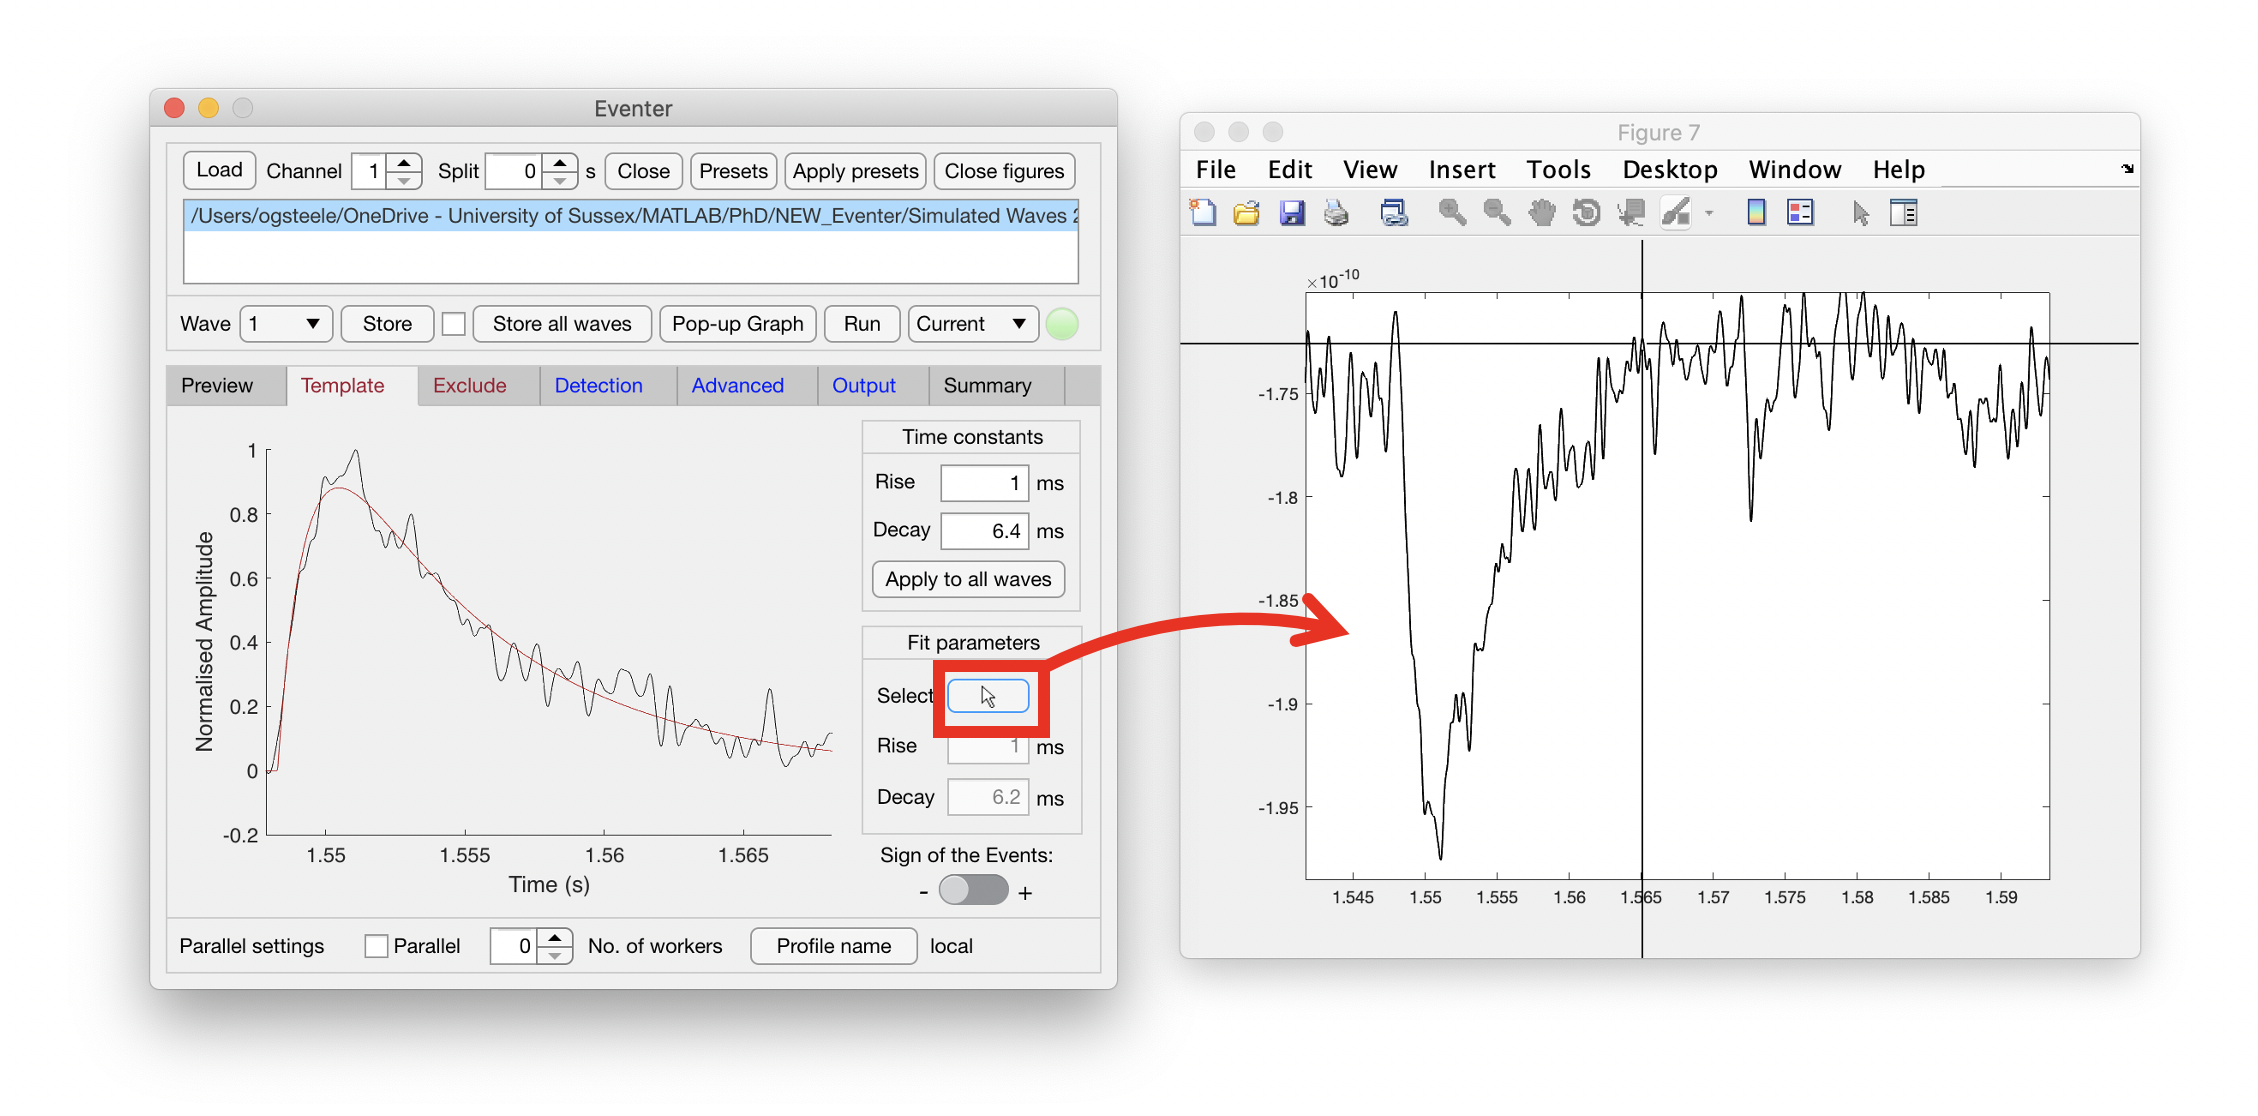
Excluding regions from your analysis
It is possible that there are regions of your data that you want to be excluded from the analysis. For example, this could be a particularly noisy section of recording or the inclusion of a test pulse as shown here. To exclude these regions, open the exclude tab and regions to be excluded can either be manually typed in or selected using the highlighted button. Selecting this button will bring up cursors similar to the template selection window.
Screenshot 2020-08-18 at 16.09.40.png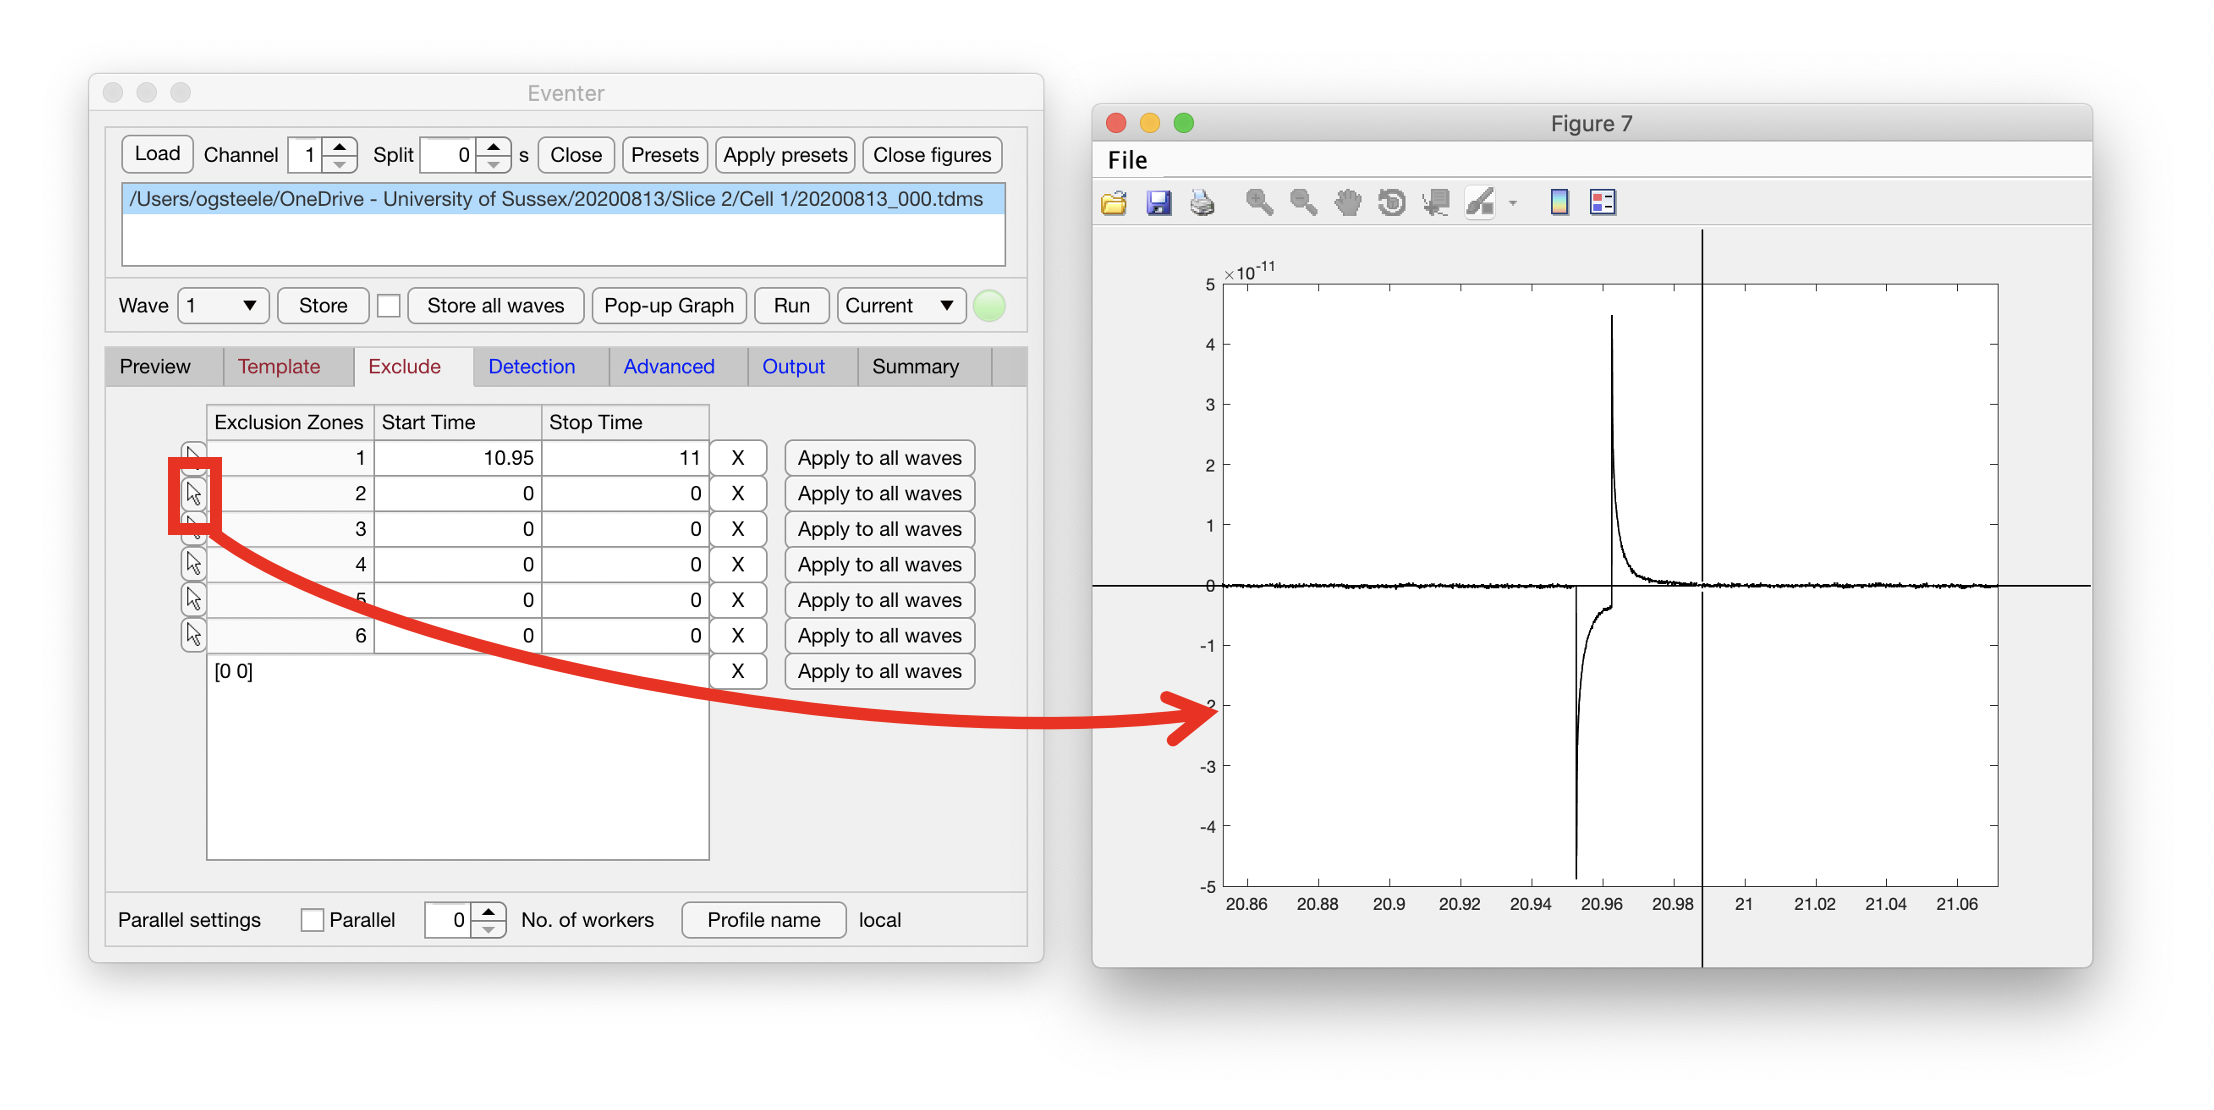
Parallel Processing
If you wish to use parallel processing which will speed up analysis on newer computers, you can choose the number of workers. The limit of how many workers you can have is dependent on how many cores and threads your CPU has. After the worker number has been chosen, check the parallel box and wait for the workers to initialize.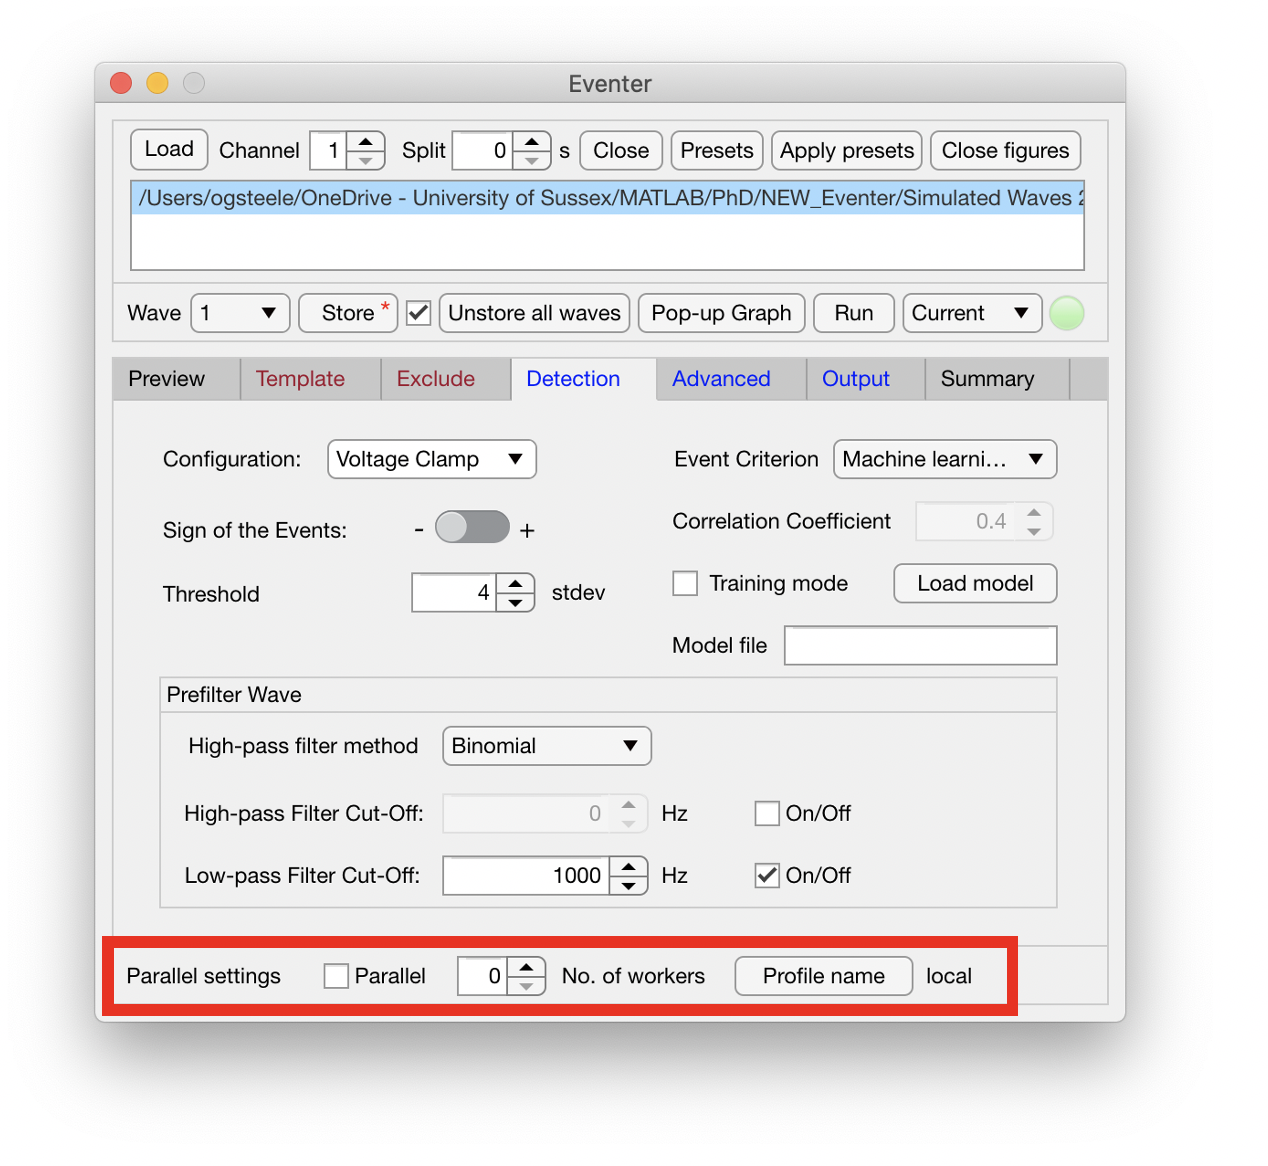
Running your analysis
Once the user is happy with the settings for their analysis, open the output tab and ensure the data will be outputted into the desired output format and saved to the appropriate location. By default this will create a folder named ‘eventer.output’ in the current working directory that the data was located. Choose which waves you would like stored in the analysis by either going through each wave individually and selecting/deselecting the store checkbox, or click the store all waves button. Unless a new output folder is specified for new analysis on the same dataset, it will be overwritten when performing new analysis.
Changing the box on the right from ‘Current’ to ‘Batch’ will tell Eventer that the analysis can be performed on the batch of waves stored, rather than solely on the current wave. If the user has not loaded multiple files or split the recording then ‘Current’ and ‘Batch’ will both be the same. Having confirmed these settings the user can hit ‘Run’ and the light will turn green indicating analysis is in progress.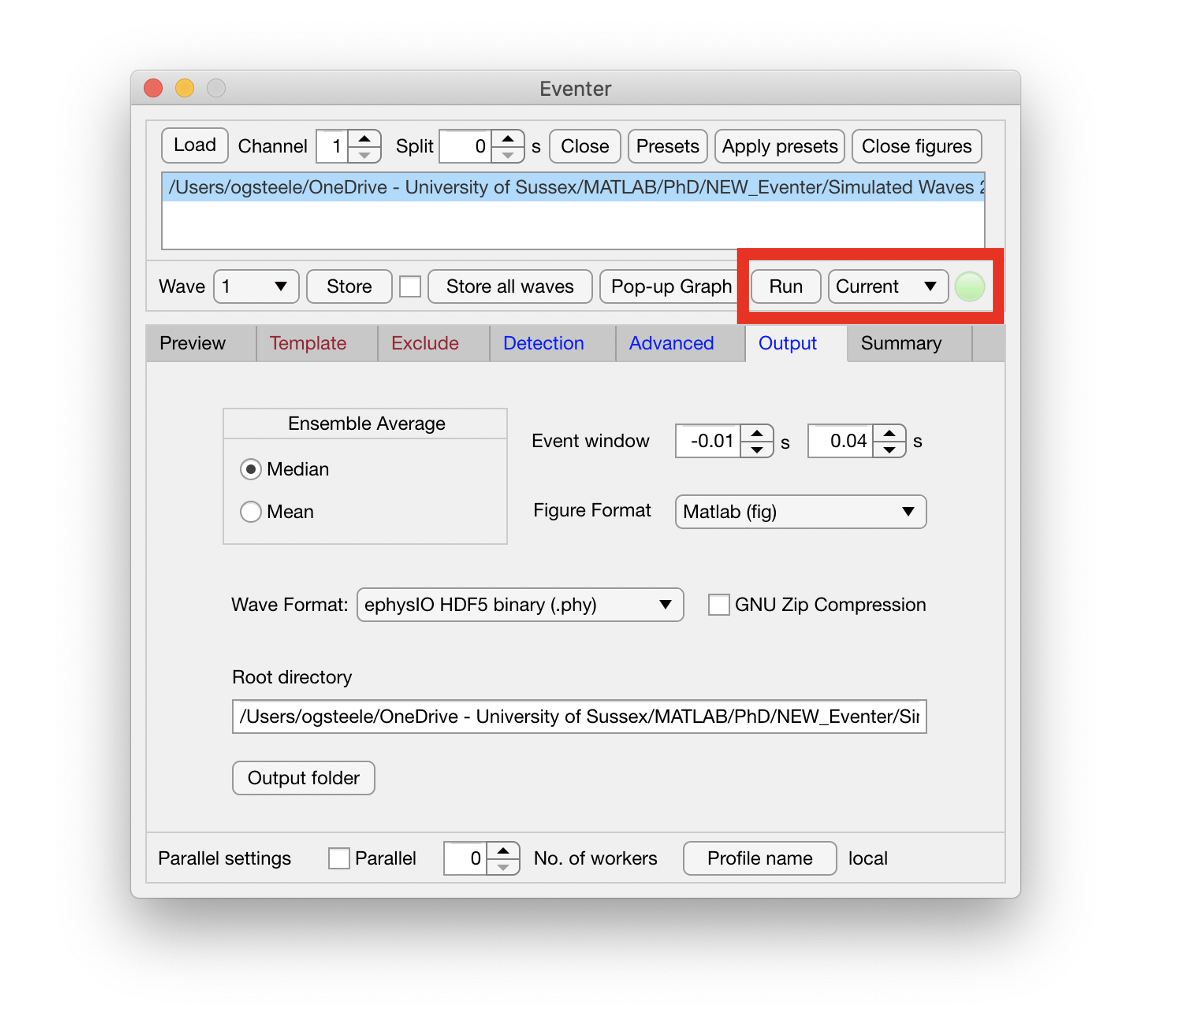
Accessing your results
After running the analysis, Eventer will open multiple figures. A quick summary of results is also available in the summary tab as shown here. The rest of your results will be saved in the root directory in the previously specified output folder.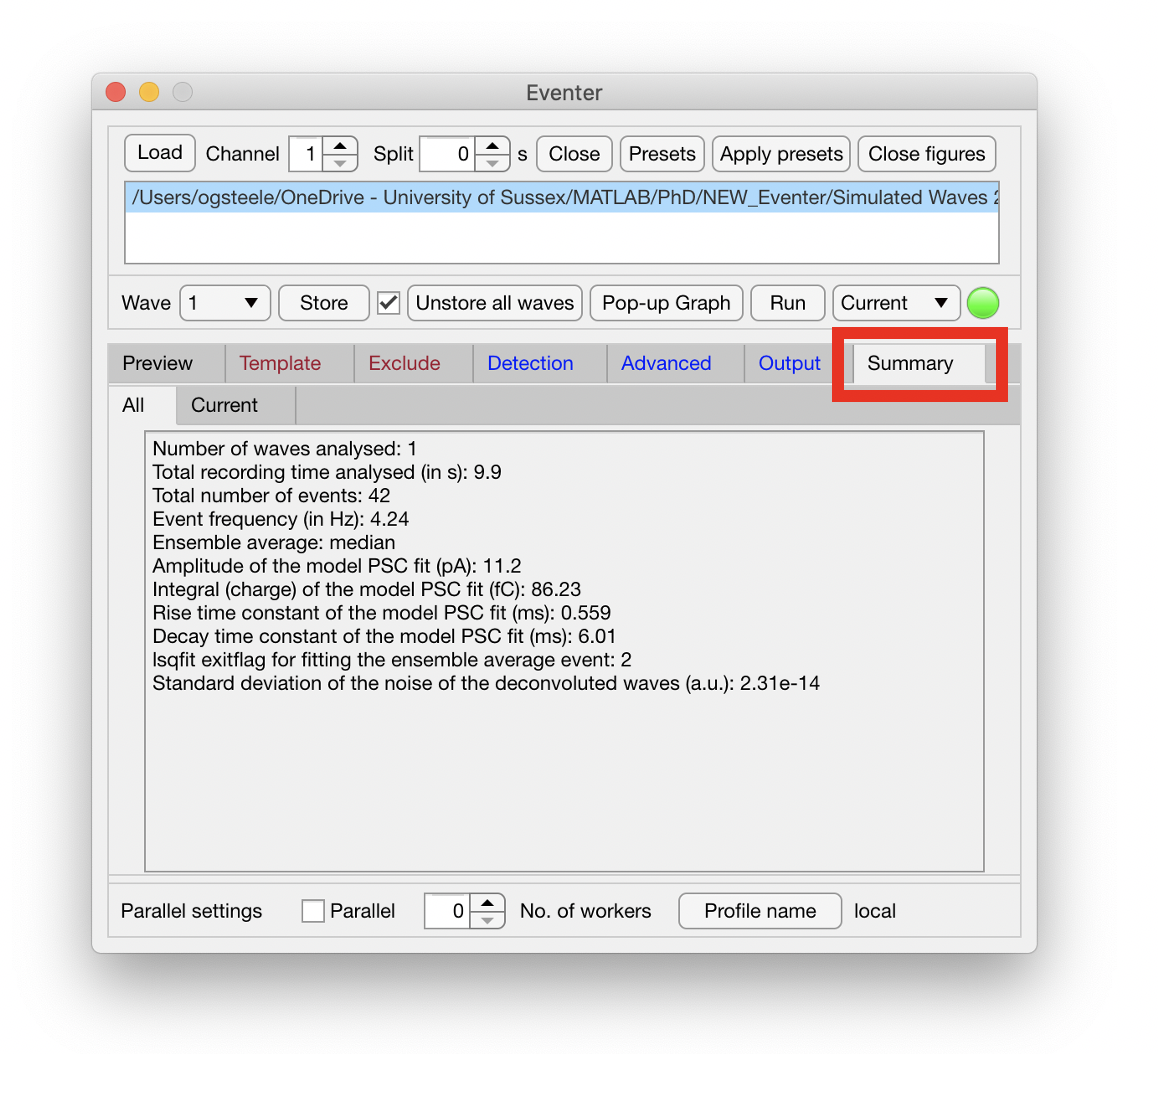
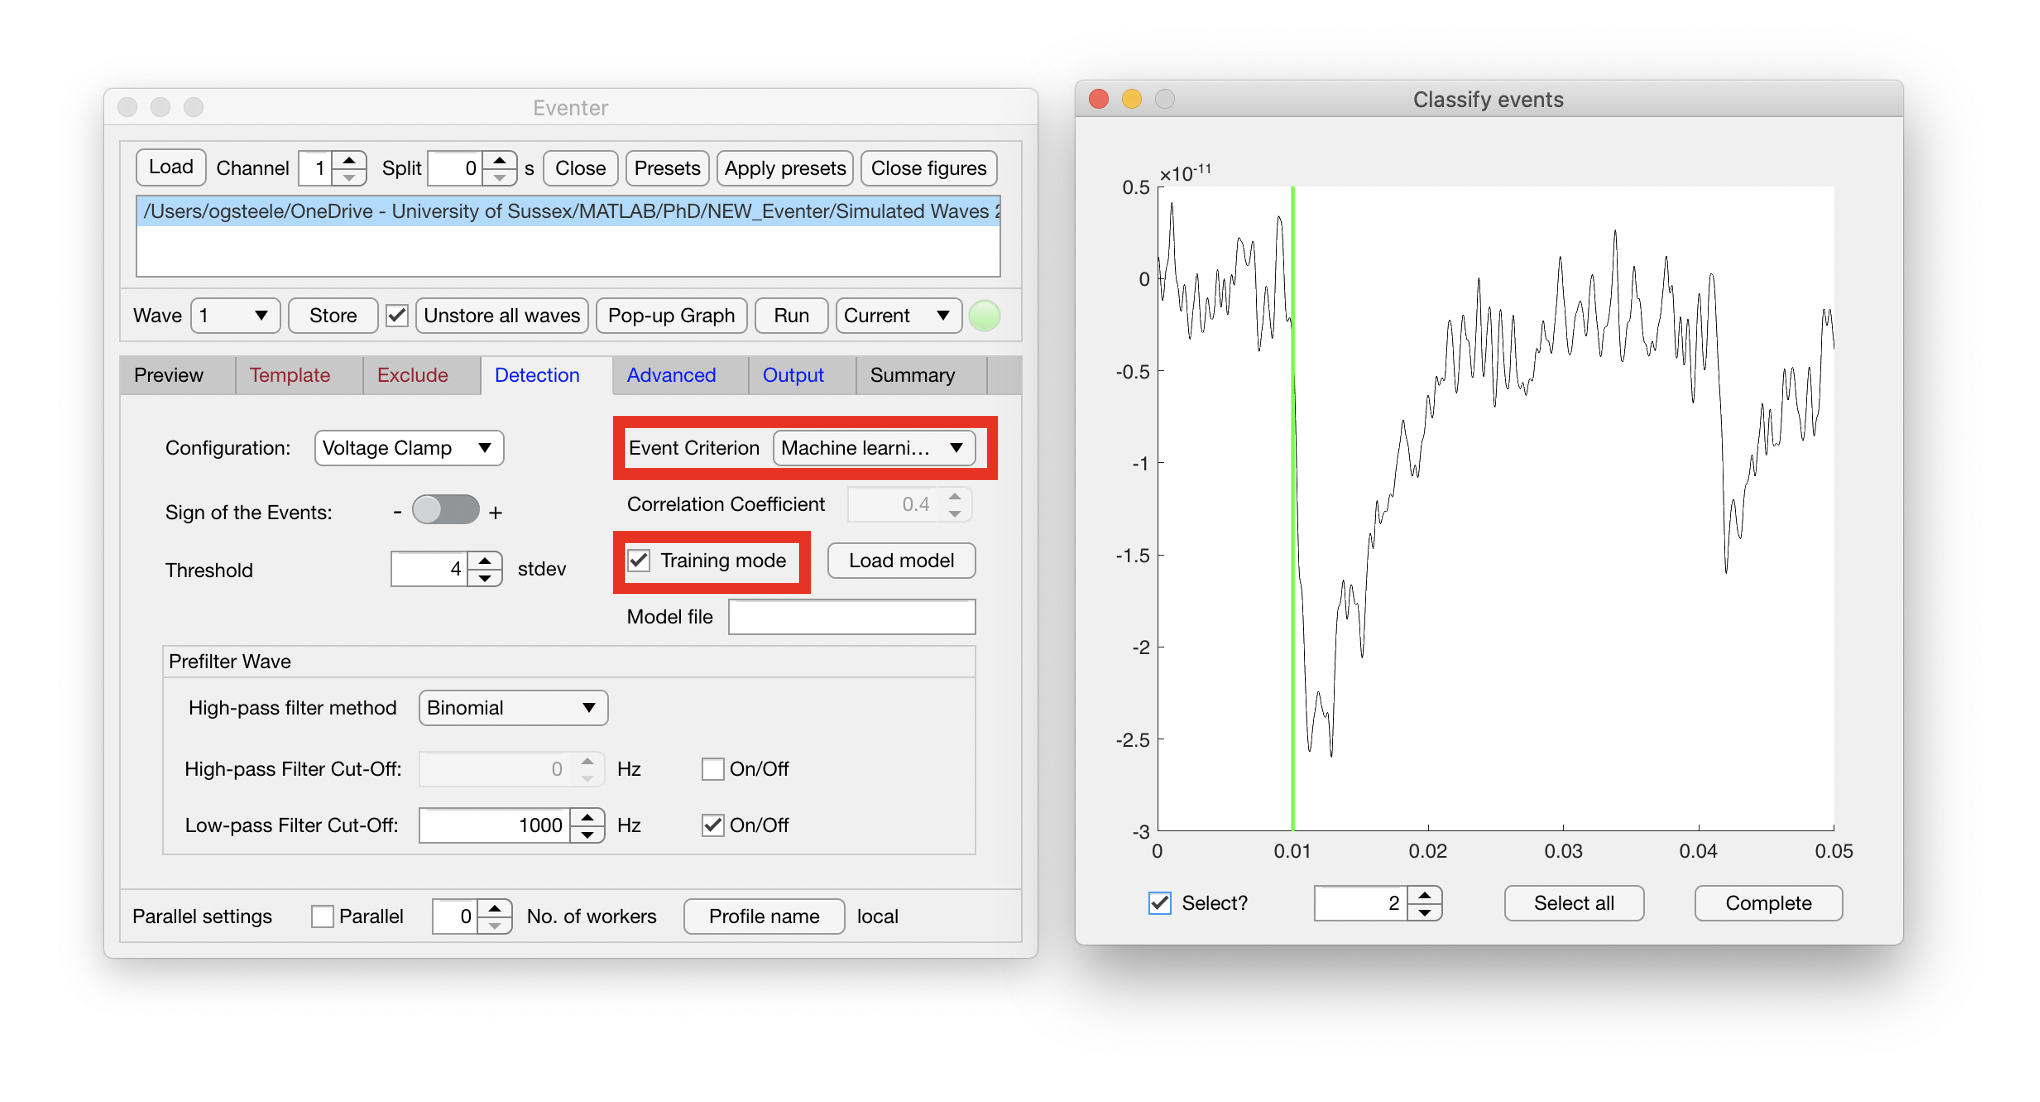
Training a machine learning model
Eventer also includes an option to enable users train a machine learning model against an exemplary set of data. To do this, open the detection tab and change the event criterion to ‘Machine Learning’ before ticking the ‘Training Mode’ tickbox. Running the analysis now will open up a window that will ask users to classify events as either events or not. A pop-up window will allow the user to also name their model. Move through the events selecting or deselecting events where appropriate until all events are classified then click complete. When selecting whether an event is indeed actually an event, it is important that the green line shown above is exactly at the start of where you perceive the event to be otherwise the model may become inaccurate.
Upon completing your classification task, you will be presented with a plot showing the out-of-bag classification error which can briefly be described as a measure of the prediction error using bootstrap aggregating (bagging) to subsample data samples used for training. The prediction error should then stabilize well before reaching 128 trees (which is the default number of trees used by the implementation of Random Forests in Eventer).
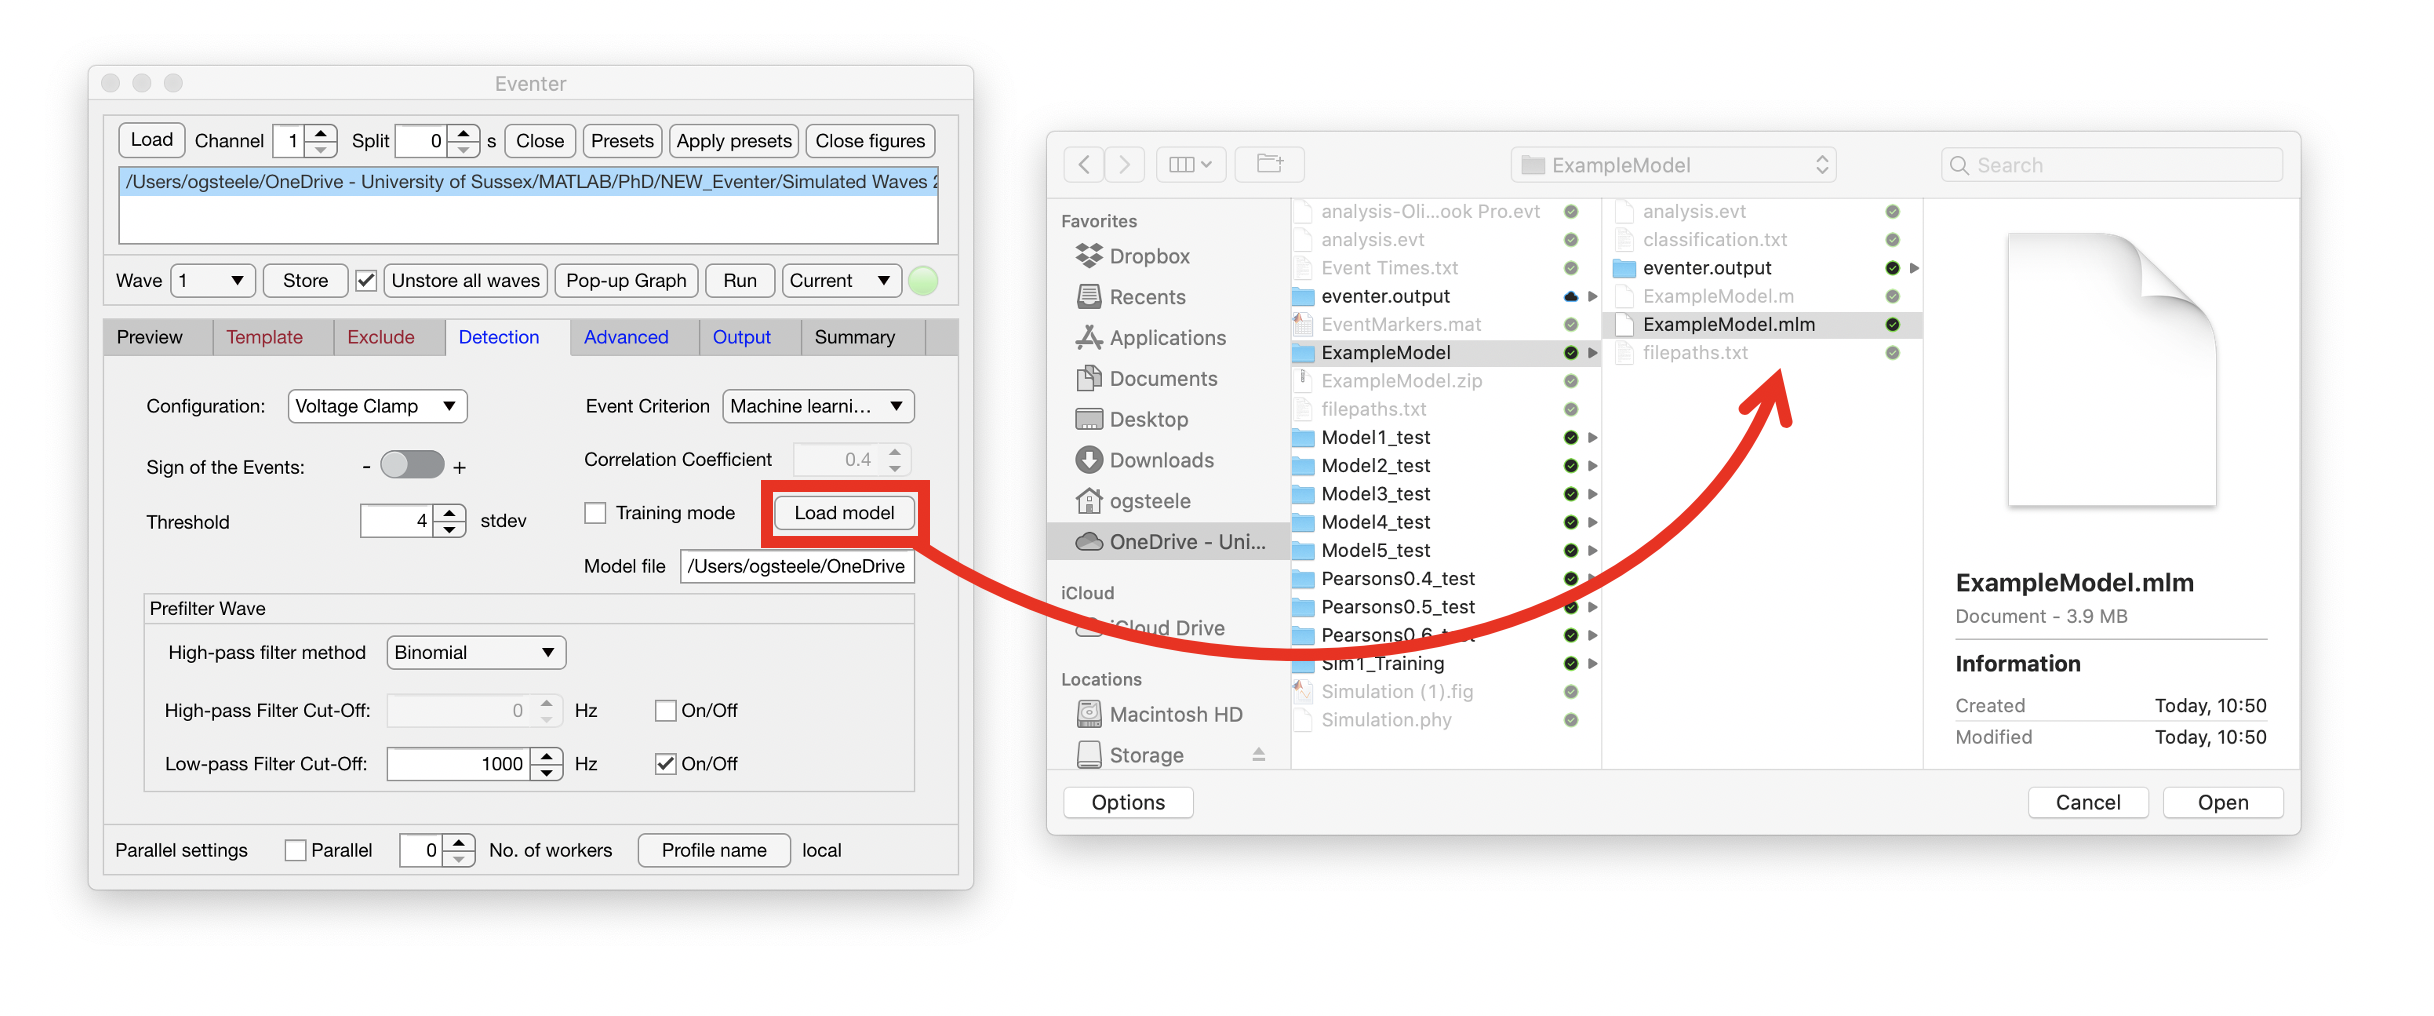
Using your model
To then use the trained model on subsequent analysis, the user can then deselect the training mode and select load model in the detection tab. The trained model will be stored in the eventer output folder as a .mlm file as shown here. This model is now available for use on a new dataset, distinct from the set it was trained on.